Viewer
- First Steps
- ROI-Tool
- Fiber Viewer
- Projects and Subject/Studies
- Autoloaders
- Marker-Tool
- Navigation Tool (alignment and deformations)
- URL Calls and Sharedlinks
- Reading Tool
First Steps
Learning by doing is most of the times the best option. So, try out the demos on
to get an inital experience. Note that there is also a non-web version of the viewer (packed in electron) to allow local non-internet usage of the viewer (download also here)
NORA's desktop
NORA's basic working screen is like that: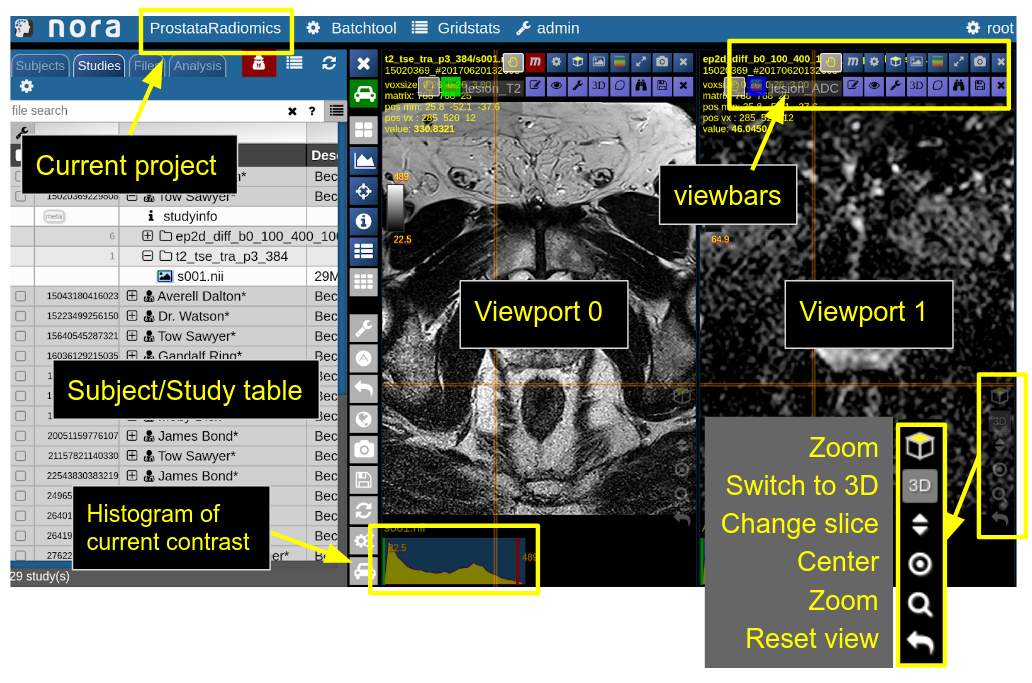
NORA's imaging data is organized in projects. Each projects contains a set of subjects/studies, which appear in the left table of the desktop.
Loading data for viewing happens in most of the cases per drag&drop. You can drag images from the subject/study table (see here for more about the table) into the viewports on the right. By double-clicking a file its content is loaded and placed into next available viewport. You can also drag&drop files from your local computer into the viewports for visulization (note that the data is not uploaded, it stays on your local machine).
Depending on the file type different drop options appear in the viewports. For example, if you want to overlay one image onto another just drop on "drop as overlay". Hence, each viewport can contain multiple items: a background, overlays, masks, fibers and surfaces (in 3D) etc.. Corresponding to each item a viewbar appears in the upper right corner of the viewport. The viewbar controls the appearence of the associated object/contrast. Most properties (colormapping, outlines, etc.) are set for all instances of the object in all viewports. If you want to choose the same object to have different appearence properties in different viewports use the shift key while selecting the property.
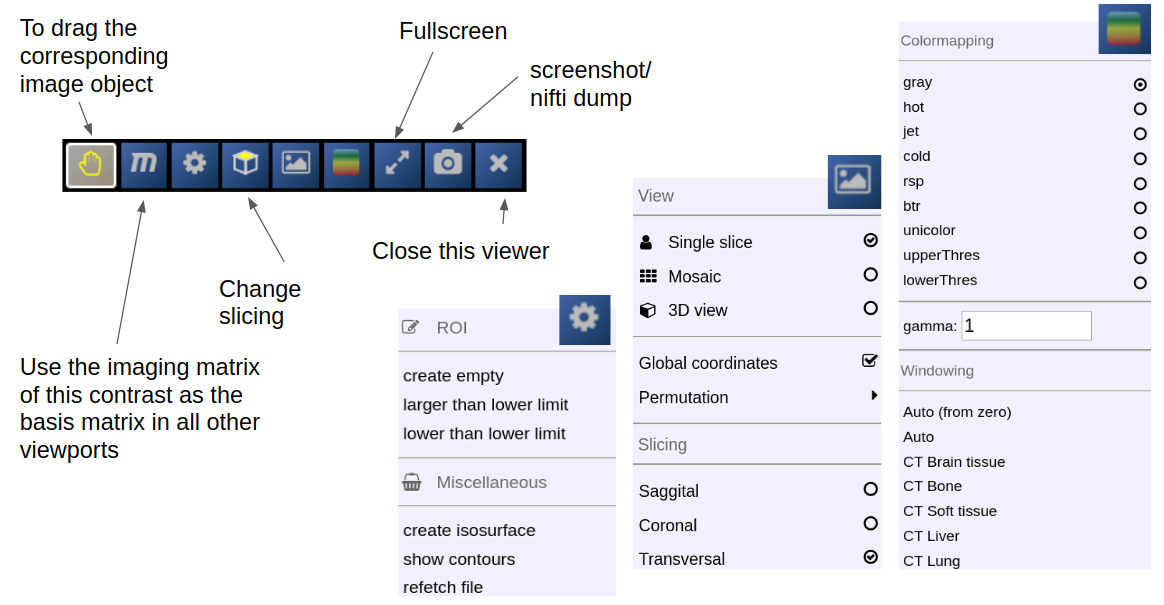
The viewbar of the "background" image is organzed as follows
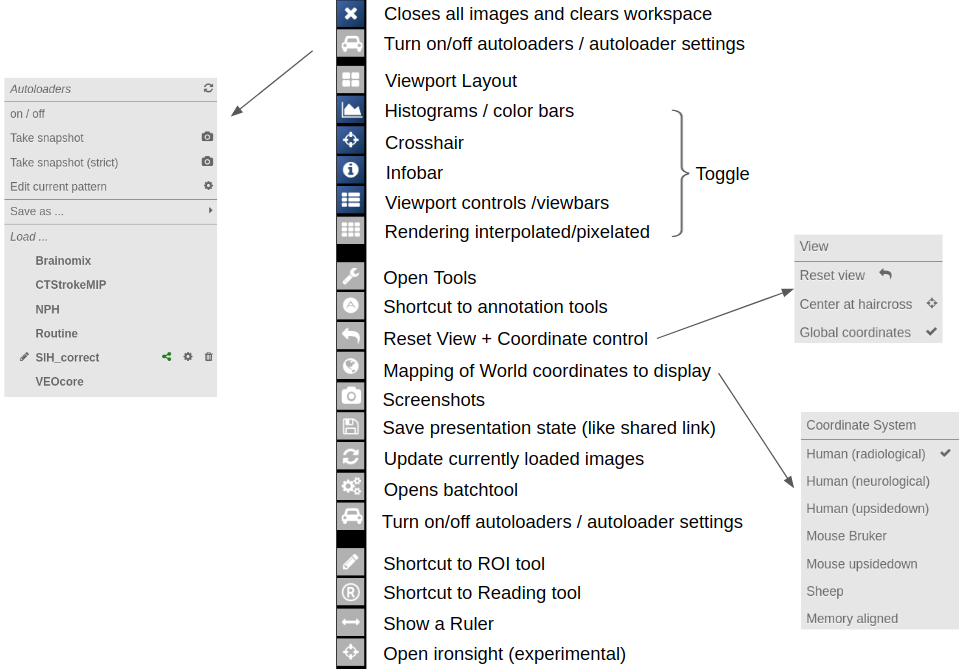
Central Toolbar
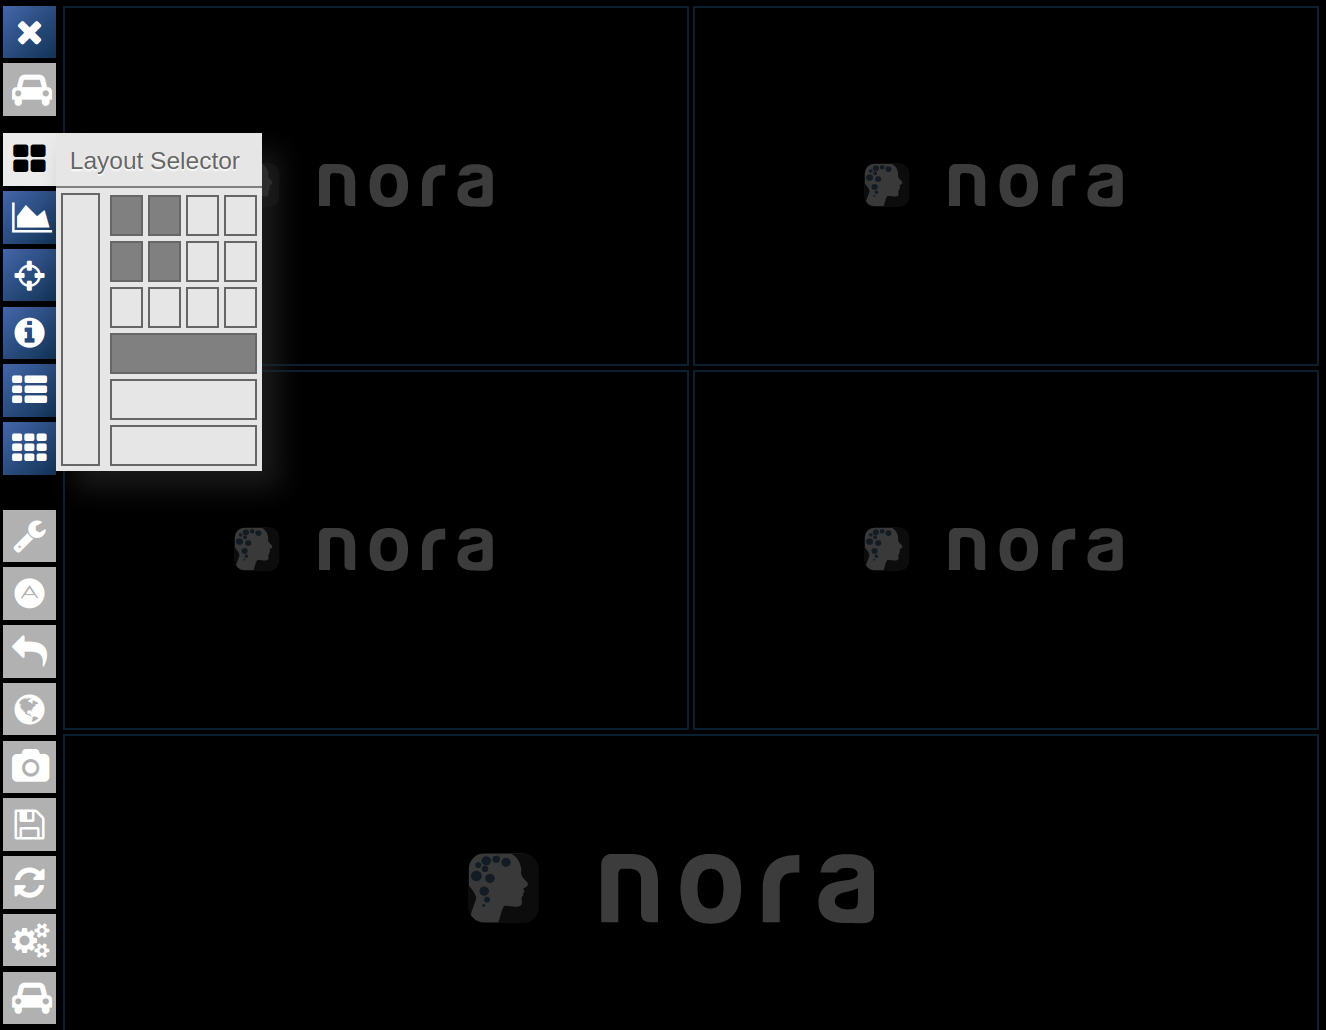
Viewports and Viewer Layout
To control the layout of the viewports use the layout selector located at the central toolbar. Note that for the horizontal viewports at the bottom a mosaic view is default.
Mouse
| Mouse wheel | change slice |
| Ctrl + Mouse wheel | zoom |
| Right mouse button (hold down) | pan |
| Left mouse buttom click | change position of crosshair (world position) |
| Middle mouse button | Change windowing |
| Ctrl + Left Mouse button hold | Reformatting MPR (rotation/translation) , see Navigation Tool |
Keyboard Shortcuts
| 1-6,0 | shortcuts to standard CT windowings |
| Space | toggle ROI edit, see ROI tool |
| s | open settings window |
| x,y | decrease/increase scroll speed |
| arrow up/down | change subject (when using autoloader) |
| (shift) Ctrl-Z | Undo/Redo ROI drawing |
ROI-Tool
 The ROI-Tool
The term Region of Interest (ROI) is used throughout the tutorial as a synonym for a "Mask", "Binary Mask", "Segmentation" or "Volume of Interest". Technically, it is a binary 3D volumetric image matrix, which is quite similar to 3D image apart from the fact that voxel values are binary (on or off). Thus, a ROI has also the same properties as image (like resolution and matrix size). ROIs can also be just 2D, however, one has to be remember that the 2D slice has also a position in 3D space, which can sometimes be confusing.
ROIs are close to what is represented by DICOM SEG objects.
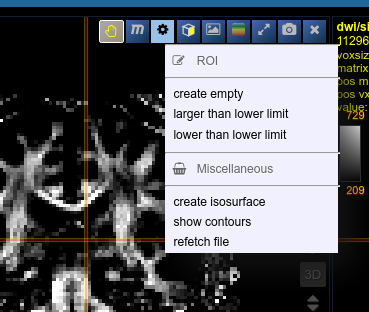
To open the ROI-tool just go via the toolbox menu of the vertical iconbar or use the shortcut via the "pen" icon:
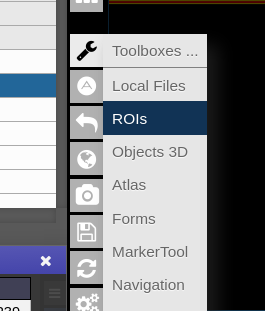
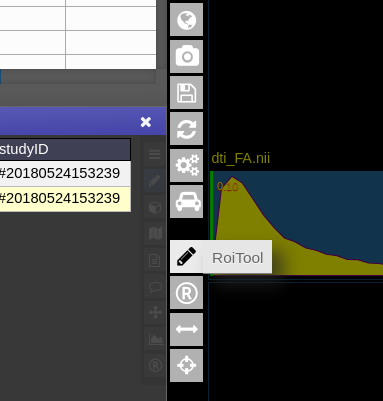
This opens the following toolbox window, which contains the access to all functionalities of the ROI-tool
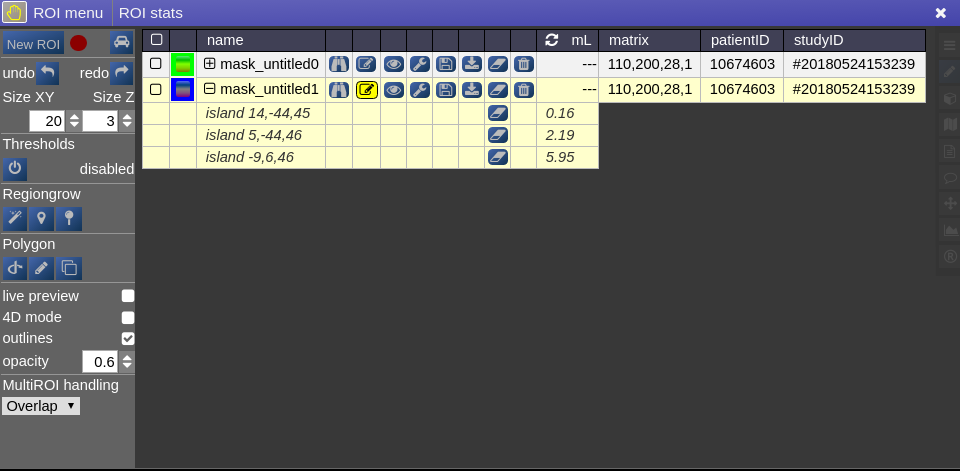
On the right you have list of currently opened ROIs togeter with information about matrix size and patientID/studyID. There is also information about the size of ROI and several tool icons:
|
focuses the position of the viewer to the center of gravity of the current ROI |
|
|
|
turns the ROI to be the "current ROI" on which currently is drawn on |
 |
toggles the visiblity of the ROI in all viewports |
 |
open several options to modfiy ROIs (see below: ROI operations) |
 |
save the ROI (upload to server) |
 |
downloads the ROI to your local computer |
 |
erases/clears all on voxels of the ROI |
 |
deletes the ROI from workspace |

Drawing and Pens
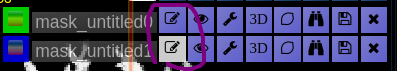
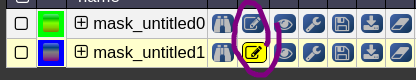
Generally, the left mouse button turns voxels on, while right mouse button eraśes voxels. Drawing happens always on the ROI which is currently selected for drawing. You can select
a ROI for drawing by highlighting the pencil icon in the viewbar, or in the ROItool
A shortcut for switching drawing on/off you cane use the spacebar. You can also hold shift pressed while being in drawing mode to disable mouse drawning features.
On the left panel of the ROI-tool the current type of pen mode (pen type) and the size of the pen can be set. You can turn on "live preview" to see what the current pen would draw. Displayed opacity of the ROI can be determined and whether outlines are drawn. The available pen types are as follows:
|
|
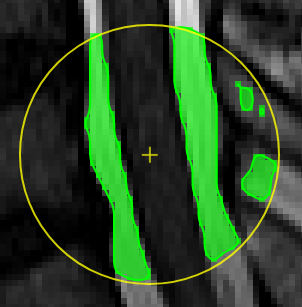
Thresholding based pen.Depending on the threshold (either choose clImL/R or an actual number) the pen turns voxels ON, which are above ("Higher") or below ("Lower") the threshold. Additional you can select "Higher RGrow"/"Lower RGrow" to enforce the ON voxels to be connected to the central voxel.
|
|
|
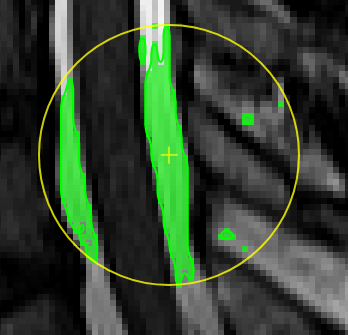
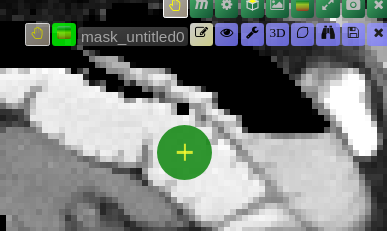
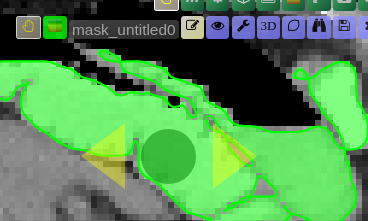
Magic pen (unconnected).Turns voxel ON, which have a 1) similar contrast compared to the central voxel, 2) are within pen's radius. The similarity depends on the color limits chosen for the current contrasts.
|
|
|
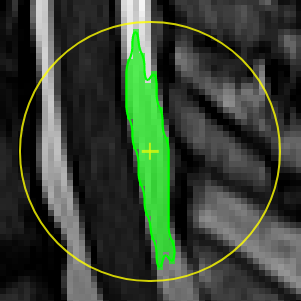
Magic pen (connected).Turns voxel ON, which have a 1) similar contrast compared to the central voxel, 2) are within pen's radius. and 3) are connected to central voxel via a region growing approach. The similarity depends on the color limits chosen for the current contrasts.
|
|
|
Unconstrained 3D region Growing.Select a pixel by keeping left mouse button pressed. By moving the mouse left/right (while mouse pressed) the similarity threshold can be changed.
|
|
|
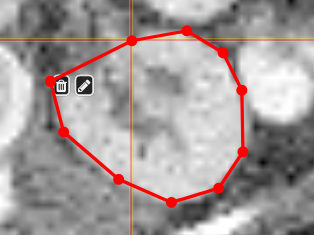
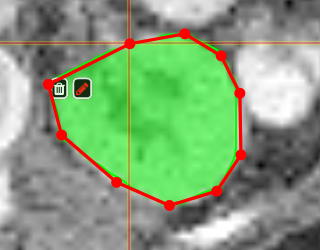
PolygontoolUse the polygon tool to determine a ROI by its outline. You can either create the outline by holding the mouse button down, or click by click. You can also move points of the outline manually after creation. Use trashcan to delete outline, use the pencil to render the polygon into the current ROI enabled for drawing.
|


 move the mouse left/right to adapt size
Creating a ROI
To create you always have to give a reference on which basis the underlying geometry the ROI is created. There are several ways to do this:
- Take an existing onto ROI-tool by dragging the hand-icon

from the viewbar of the image (or the file from patienttable) and decide on the type of creation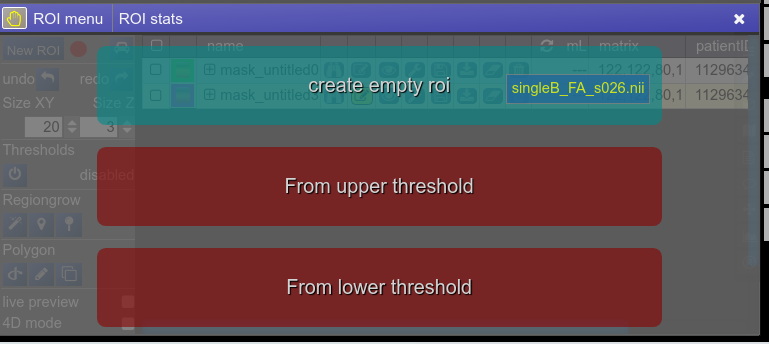
The threshold for creation is the lower limit of the current windowing of the contrast - Or use the cog-wheel item of the viewbar to do the same thing.

- Or just use the "New ROI" button in ROI-tool itself.


 ROI operations
- Morphological Operations: NORA provides the typical 4 operations (erosion, dilation, opening and closing) using a 6-neighborhood in the slicing of the ROI matrix, i.e. the size of the neighborhood varies depending on the underlying matrix size.
- Set Operations: NORA provides intersection, union and set difference. Select
- Remove Salt: Does a connected component analysis and removes components than the given threshold.
ROI statistics
Open the ROIstats window by clicking on the menubar in the ROI-tool
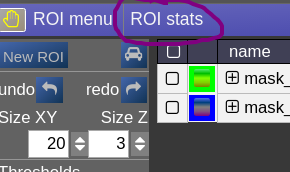
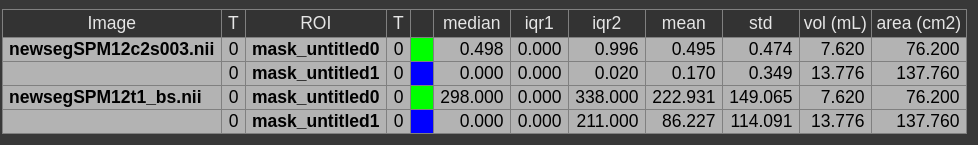
The ROI statitics table appears which computes for all possible combinations of contrasts and ROIs currently present in the viewer the following statistics:
- median of contrast (percentile 50%)
- iqr1/iqr2 - inter quartile ranges (percentile 25% and 75%)
- mean/std - mean and standrad deviation
- volume (in mL)
- area (in cm2, makes only sense when ROI is 2D, or a single slice in the matrix)
Fiber Viewer
NORA includes fiberviewer based on webGL and Babylon.js. The main features are:
- Supports TCK (mrtrix) and TRK (TrackVis) formats
- Fiber Manipulations
- Interactive selection by variable sized spheres
- Interactive deletion by variable sized sphere
- Selection and Deletion of tracts by ROIs
- Selection by sphere sets, (annotation type: poinset)
- Selection by waypoints (annotation type: freeline)
- Selection by DBS electrodes
- Rendering
- Vistmaps (fiber densities)
- Terminalmaps
- LIveupdate of visit/terminal maps
- Tracking
- a simplistic fibertracking algorithm based on tensor/orientationl fields is provided
Starting the fiber viewer
Choose an appropriate background image (like a T1w) and simply drop a tck or trk file into a viewport and the viewer will automatically switch to 3D mode a displays the fibers. An additional viewbar appears, which is associated with the loaded tracts. The viewbars allows you manipulate the streamlines, select subsets, etc. Here a short overview:
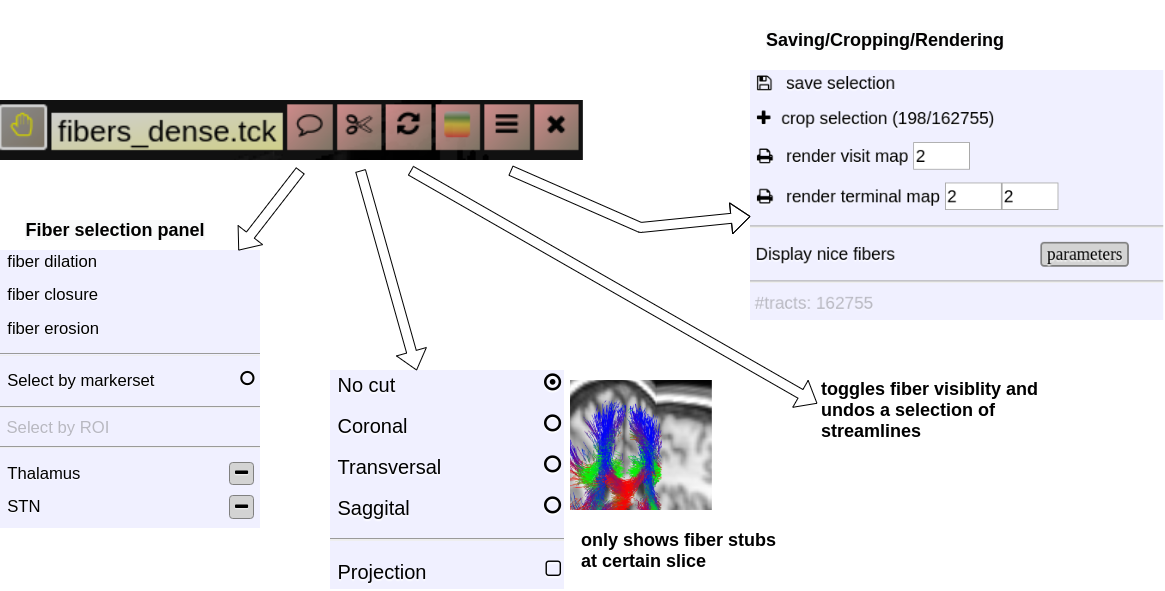
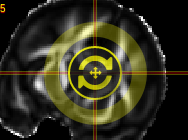
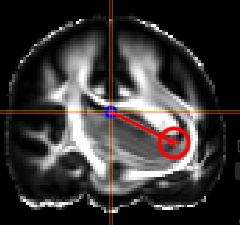
Fiber Selection
- Manually:
Hold Shift key pressed, a yellow sphere appears when hovering with mouse over the tracking, click to select all fibers going through the - By ROI:
- By Annotation:
Cropping Selections and iterative selections.
Some slides explaining NORA' s fiber viewer
Projects and Subject/Studies
Projects
NORA's subject pools are called "Projects". Each user has rights to see a certain subset of projects. The subject/study table on NORA's desktop shows only the subjects/studies of the current project. Projects can differ in their nameing conventions (anonym) and way of storing the data in the backend. They can also have custom processing functions and autoexecution queues.
Subjects/Studies

Filterbars
Use the filter bars to select a subset of studies/subjects. All bars share the following funtionalities: multiple queries are separated by spaces and are interpreted as a "OR" concatenation. If you want to combine expressions that have to be simultanously fulfilled use an explicit "&" sign. All expression have implicity a wildcard at the end of the pattern. For example, search for all patients, whose given name start with A or B, write "A B" into the filter bar of the name column. The "file search" bar can be used to select studies that contain files which match the given file pattern. Explicit wildcards are * and _, where * represents zero or more arbitrary characters and _ represents exactly one abitrary character.
Examples for file searches:
- All studies that have a T1 from a trio:
t1_trio*/s0*.nii - Sometimes naming conventions are different, so use multiple queries:
t1_trio*/s0*.nii MPR_t1*/s*.nii - If you want to restrict for those which have specific study tag:
t1_tri*/s0*.nii & STAG:control
There are special search attributes:
STAG, PTAG, FTAG, JOB, SDESC
For example, search for all studies, which have the tag "control"
STAG:control
Jobs can be queues (q) or running (r) or errornous (e). Find all subjects that have an errornous job
JOB:e
Using Tags
Subjects, studies and files can be decorated with tags. Use the context menu to assign tags. Tags help to group and label items. Files can have special tags
Autoloaders
Marker-Tool
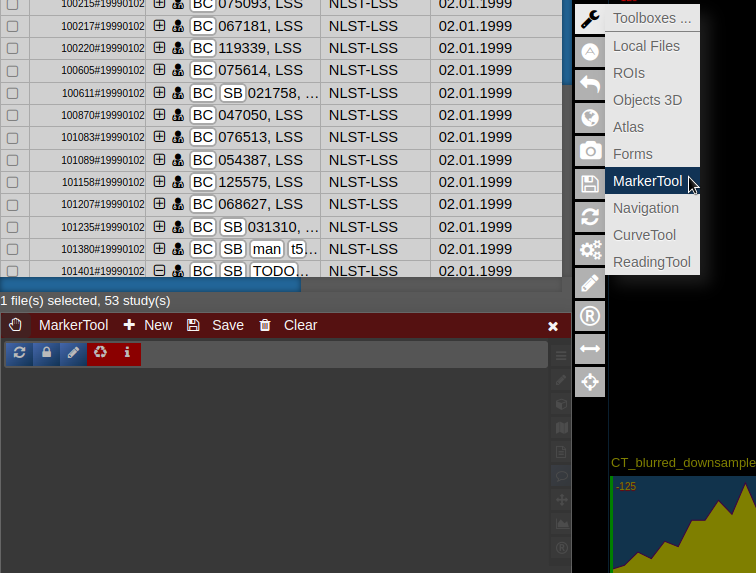
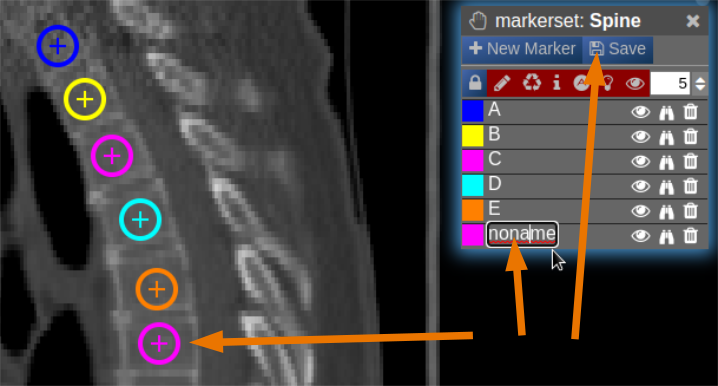
The Marker-Tool enables other types of labels, for instance point-labels.
- To open it click on the wrench symbol an select "Marker Tool".
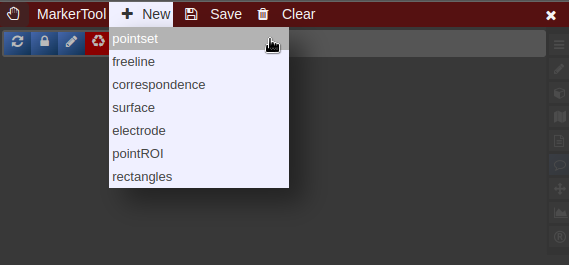
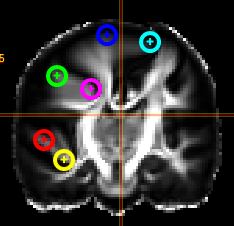
- To create a new pointset go to the menu of the Marker-Tool and select "new+" -> "pointset".
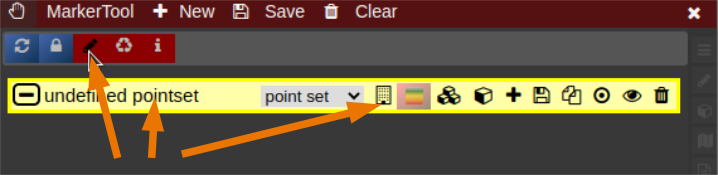
- The pointset can be renamed by clicking on the text in the yellow bar. To enable a list view closer to the image, select the respective list symbol from the yellow bar. To enable adding points by clicking on the image, select the pen symbol.
- Now points are added by clicking on the image. The points are renamed by selecting the text in the list. When finished the pointset must be saved by clicking on the "Save" button. The pointset is stored in a subfolder "annotations" of the current patient.
 |
|
 |
Navigation Tool (alignment and deformations)
NORA provides the possibility to manually align volumetric images (nifits) in a rigid (affine) and deformable fashion. You can interactively translate/rotate/scale the images by holding the Ctrl-key and using the mouse with the yellow crosshair symbol. The deformable transformation is specified by either a set of displacements, or by two set of matching keypoints.
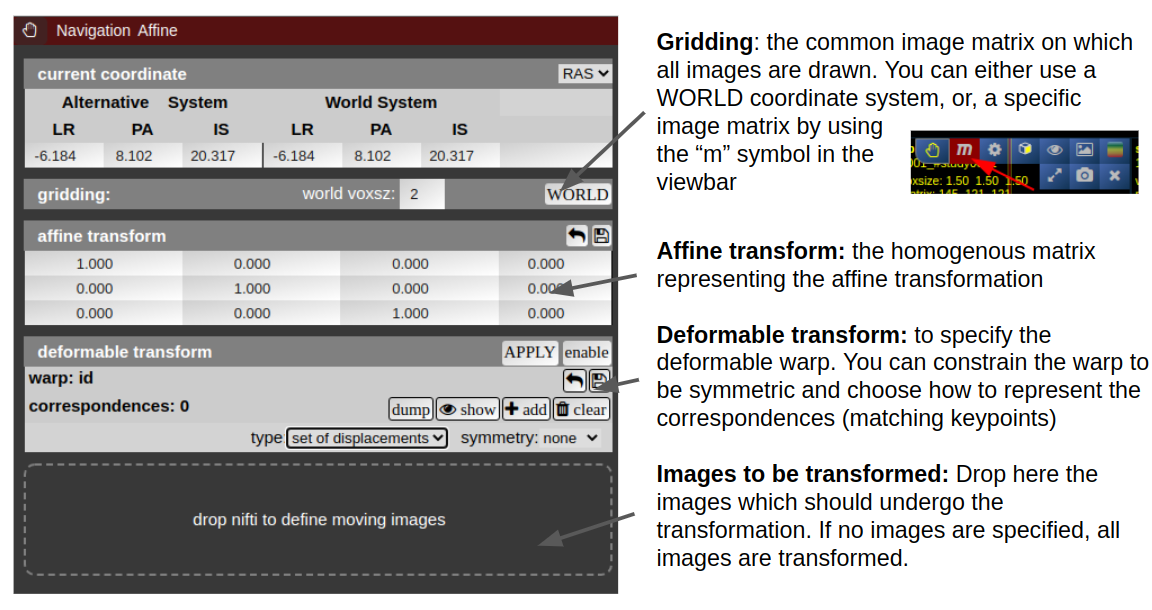
By default, all images are transformed/moving. You can also specify the "moving" images by dropping the nifti into the navigation tool. The moving images are shown in the lower box of the tool. Using the APPLY button(s) the current transformation is applied and written to the niftis defined as 'moving'.
Transformation results are only displayed when the "gridding" is defined to be on one common image matrix. Use either the "world"-image matrix by clicking on the WORLD button or use the "m" symbol on the viewbar of a specific nifti to use the image matrix of this specific nifti. The "world"-system uses a matrix with bounding box including all visible niftis and the voxel size given.
Deformable transformations (warping)
To create a warp field, press the "enable" button in the deformable transform section. By default you can add displacement markers ("correspondences") by pressing the "add" button. The size of the marker defines the extent of the displacement. You can combine multiple displacements. Each displacement is represented by a Gaussian shaped displacement field. By pressing the "dump" button, the displacements markers are rendered as a combined displacement field and markers are deleted. On top of this "dumped" displacement field you can now add again new displacements. Instead of using displacements, one can use two sets of keypoints. Therefore, choose in the "type" combo-box "pair of sets".
URL Calls and Sharedlinks
Shared links (hanging protocols)
Suppose you have arranged a case in the viewer and want to send it to partner, you can save the state and generate a link to access the state via
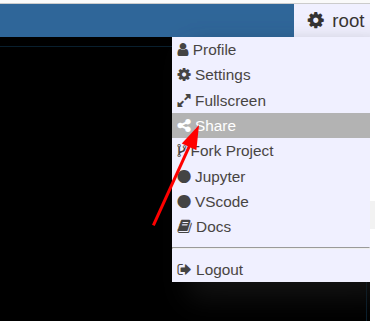
If you have called a link, you can modify and use again the "share" button to overwrite the old link (or create a new one).
URL calls
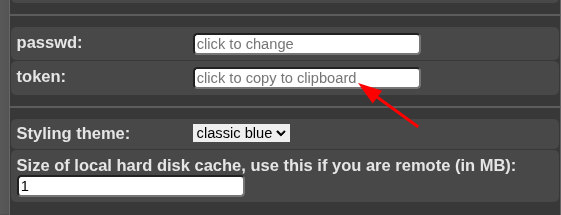
Suppose you have a NORA project with configured autoloader and want to call a specific case from an external application. You can call NORA via
https://nora.ukl.uni-freiburg.de/godzilla/index.php?asuser=root&project=WHATEVER&call={"pid":"yourpatientid","sid":"your studyid","selmode":"yourmode","preset":"youpresetname","user":"username","token":"yourtoken"}The only mandatory options are "user" and "token" for authentication (if you are not already authenticated). Get the token from your profile. Note that you need to create your own password (LDAP authentication is not possible).
Reading Tool
Overview
The Reading Tool enables structured and controlled reading sessions for medical imaging studies. It is designed for both individual and multi-reader scenarios — supporting reproducible reading performance measurements, rater comparison, and annotation-based tasks.
Readings can be configured flexibly: randomized, blinded, repeated, or staged, depending on the study design. Results are stored securely and can be reviewed or exported by reading administrators.
Use Cases
-
Controlled Reading Studies: Measure inter- and intra-rater performance, reproducibility, or the impact of AI assistance.
-
Annotation Tasks: When a single reader annotates or tags cases manually, using the patient table and tag system may be more practical.
-
Training Scenarios: Allow readers to familiarize themselves with representative cases before entering a serious reading phase
Key Features
1. Forms & Rating
-
Create rating forms or questionnaires using the form designer.
-
Readers fill out these forms during reading sessions.
-
Form items can optionally be linked to tags in the patient or study table.
2. Image Interaction
-
Draw annotations, points, or ROIs directly on the images.
-
Combine with predefined autoloaders to automatically load the correct images and view settings.
3. Reading Modes
-
Individual Mode: Each rater works independently.
-
Joint Mode: Multiple raters collaborate on the same session.
-
Blind Modes: Control what metadata or previous results are visible to the reader.
4. Randomization & Repetition
-
Readings can be randomized per patient, study, or image.
-
Repetitions are supported to evaluate reproducibility.
-
Randomization can be deterministic or fully random.
-
Staged Readings: Different stages can present varying image contexts (e.g., raw vs. AI-assisted).
5. Training vs. Serious Mode
-
Training Mode: Assign selected cases for practice.
-
Serious Mode: Conduct the actual study under controlled conditions.
6. Workflow Control
-
Access to the patient table can be restricted or detached for fully controlled sessions.
-
Timing of each reading is automatically tracked.
-
Optionally include reading instructions or external links (e.g., Google Slides presentations).
Data & Results
-
All form entries, annotations, and timing data are stored in the NORA database.
-
Reading results can be reviewed and exported as CSV files by the reading administrator.
Usage of Reading Tool
Open the reading tool (R) in vertical toolbar 
A list of all readings you have permission to access will appear.
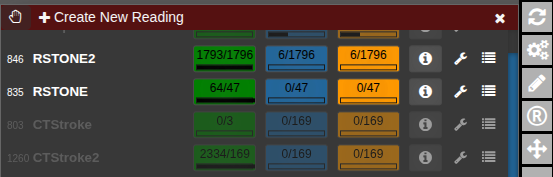
The current progress for each reading is displayed as a numerical indicator showing how many cases have been completed out of the total. To start or continue a reading, click the corresponding button. If available, the Info button opens the reading instructions provided for that session. The Wrench button allows editing of the reading configuration, while the List button displays the collected reading results. To check for newly assigned readings or updates, click Refresh from Server to synchronize with the latest data.
Configure a reading
Click Create New Reading or the Wrench button to edit an existing one. The Form Designer will appear.
general tab
In the general tab, basic settings can be set.
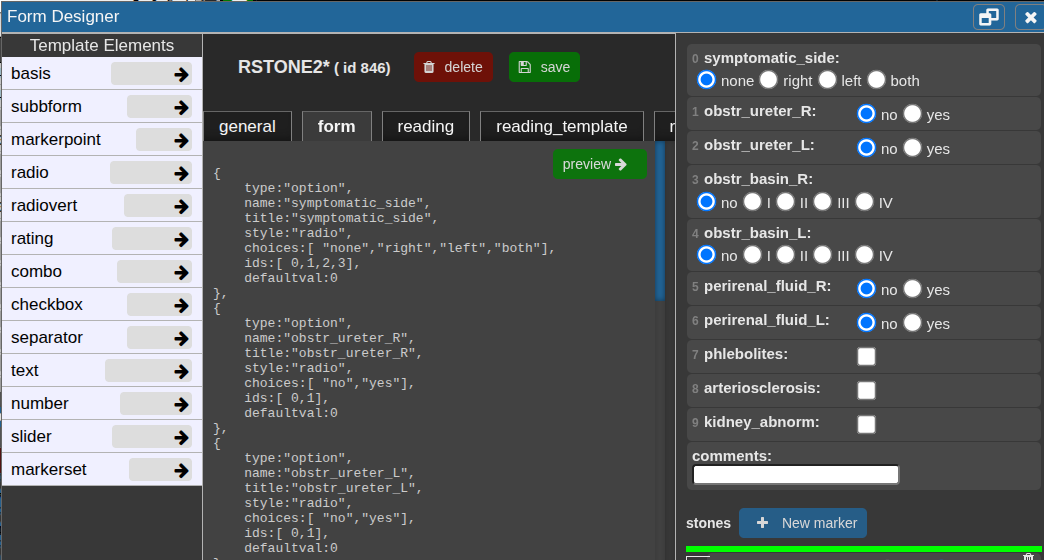
form tab
In the Form tab, define the reading form using JSON code.
Click a template element on the left to copy its JSON snippet, then paste it with Ctrl+V or click the arrow to insert it directly at the cursor position.
Use Preview → to check the JSON and view the rendered form on the right.
Add the property "useastag": 1 to radio or checkbox elements if you want them to act as tags in the patient table.
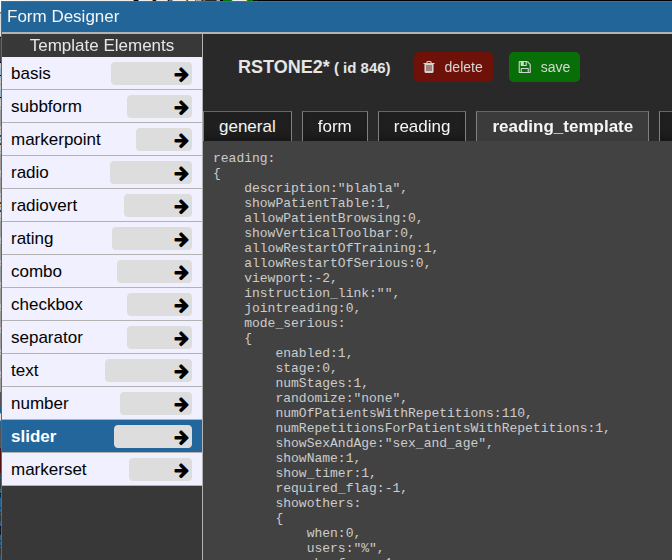
reading tab
This json contain the reading configuration. It consist of several major variables: reading, tools, and viewer.
Most properties are self-explanatory; additional details for specific options are provided below.
For a new reading, it may be empty. If so, go to the reading_template tab and copy the relevant code to start.
The reading_template contains a template for a basic reading. The viewer property always contains the current viewer settings including the autoloaders.
So if you want to change the autoloader / viewer settings, you can modify your current view accordingly, go to reading_template, at copy only the viewer portion or the relevant parts of it.
Training and serious mode
The properties mode_serious and mode_training define the respective configurations for these two stages.
Typically, training cases are marked with a study tag such as "training" and selected using an SQL condition like:SQLCondition: "STAG LIKE '%Training%'".
This allows readers to practice on predefined cases before proceeding to the serious reading phase.
Randomization
By default, readings follow the order defined in viewer.sortOrder and viewer.sortDirection.
To enable randomization, adjust the random property with one of these options:
Testing, debugging and restart
Important Notes
After the test, review the results table to verify that data is stored and displayed correctly.
Before starting the official reading and involving other readers, it is strongly recommended to consult with the system administrators to confirm that the setup is correct and stable, avoiding wasted time and effort.